With the holiday break approaching it is a great time to relax but it is also a great time to study for PSAT,SAT, and ACT. You can use the time to see what you might want to pay close attention in the second semester of Algebra 1, Geometry and Algebra 2. This PSAT/SAT Math histogram practice is a great start to your holiday practice! Let’s see how you will do!
Question(s):
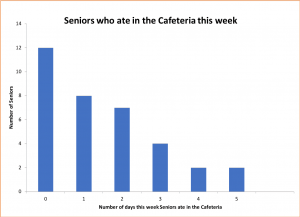
The principal at Make Believe Academy wants to determine how frequently the senior class eats lunch at the cafeteria on campus. The principal sent out a survey to 35 seniors asking, “How many times this week have they eaten in the Cafeteria?” The histogram below summarizes the results of the seniors surveyed.
Use the histogram above to answer the following questions:
1.What is the mean for the number of seniors who ate in the cafeteria this week?
A. 2.49
B. 1.49
C. 1.89
D. 1.39
E. 2.29
2. What is the median for the number of seniors who ate in the cafeteria this week?
A. 4
B. 3
C. 1
D. 0
E. 5
3. What is the mode for the number of seniors who ate in the cafeteria this week
A. 2
B. 3
C. 0
D. 1
E. 5
Solution(s):
Mean
To determine the mean, we need the total amount of times seniors ate in the cafeteria for the week. This can be found my multiplying the number of days by the number of seniors for each bar of the histogram. For example, there were 8 seniors who ate in the cafeteria 1 day this week, so that’s a total of ( 8 seniors x 1 day) =8 visits for that bar. The total calculation would be as follows:
= (12 seniors x 0 days) + (8 seniors x 1 day) +(7 seniors x 2 days) + (4 seniors x 3 days) +
( 2 seniors x 4 days) + (2 seniors x 5 days)
= 0+8+14+12+8+10
= 52 total visits to the cafeteria
Now divide the number of visits to the cafeteria by the number of seniors to find the mean: 52/35=1.49. So the correct answer is B
Median
To determine the median, you can use the information given at the beginning of the problem. “35 seniors were surveyed” this statement lets us know that we have 35 total data points. Since the median is the middle number we can divide 35/2 which gives us 17.5. Then we round up to 18 which tells us the number in the 18th position when the data is put in order is our median. Using the histogram, we know that we have 12 seniors who ate in the cafeteria 0 days, the we have 8 students who ate in the cafeteria 1 day. That’s a total of 20 seniors so our number in the 18th position must be “1”. The median is 1 and the correct answer choice is C.
Mode
What is mode? The number we see most frequently. According to the histogram, what answer did the seniors give more than any other? The tallest bar on the histogram is 0 days from which 12 seniors had this response. So the mode is “0” answer C.
If you did not get all of these questions correct it would be a great idea to brush up on data and statistics using histograms and frequency tables while applying mean, medium, and mode concepts. These concepts are seen frequently on the PSAT and SAT. Follow our blog for more PSAT & SAT practice problems!